 Easy BeezyApp StoreGoogle PlayRuStoreInstall
Finance and analytics
How to view finances and analytics
The "Finances and analytics" section brings together revenue, expenses and profit for the selected period, plus figures for services, goods, clients and employees.
Step by step
- 01
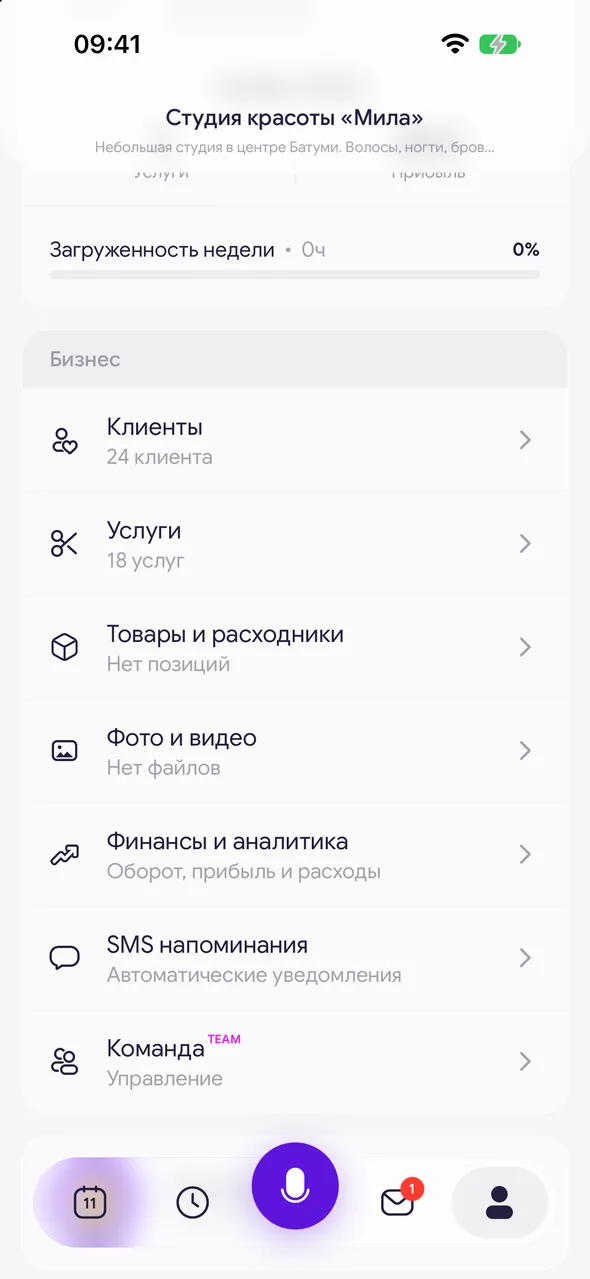
Open the section
"Profile" - the "Finance & analytics" row (Turnover, profit and expenses).
- 02
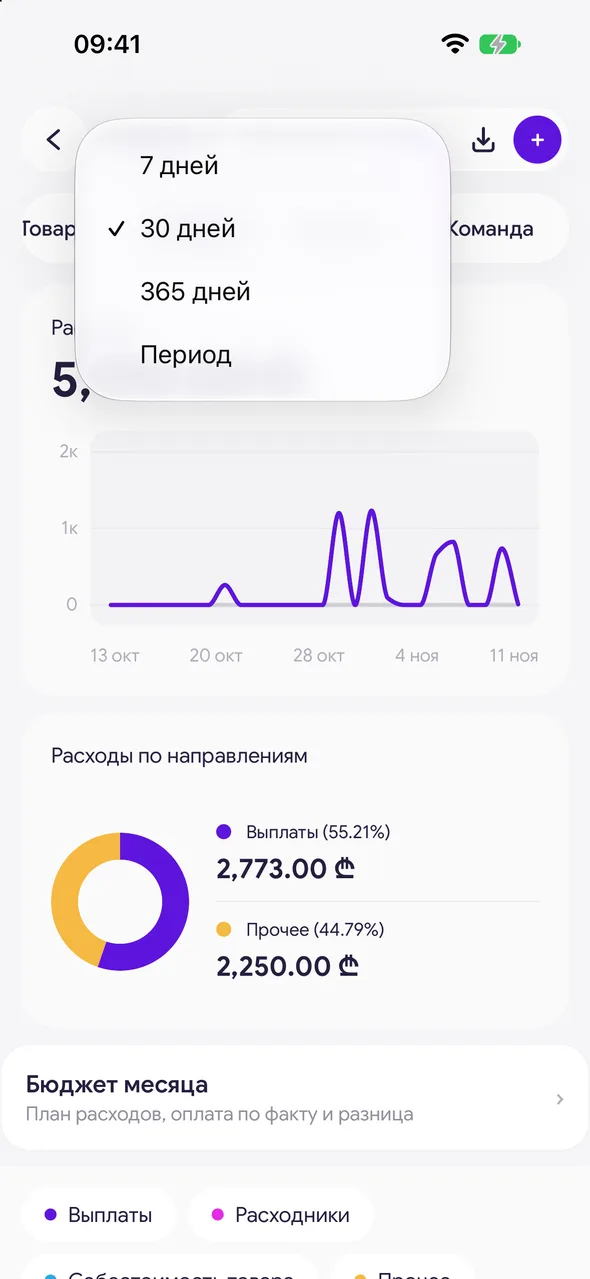
Choose a period
In the header, tap the period: "7 days", "30 days", "365 days" or "Period" with your own dates. All tabs are calculated for this period and compared with the previous one of the same length.
- 03
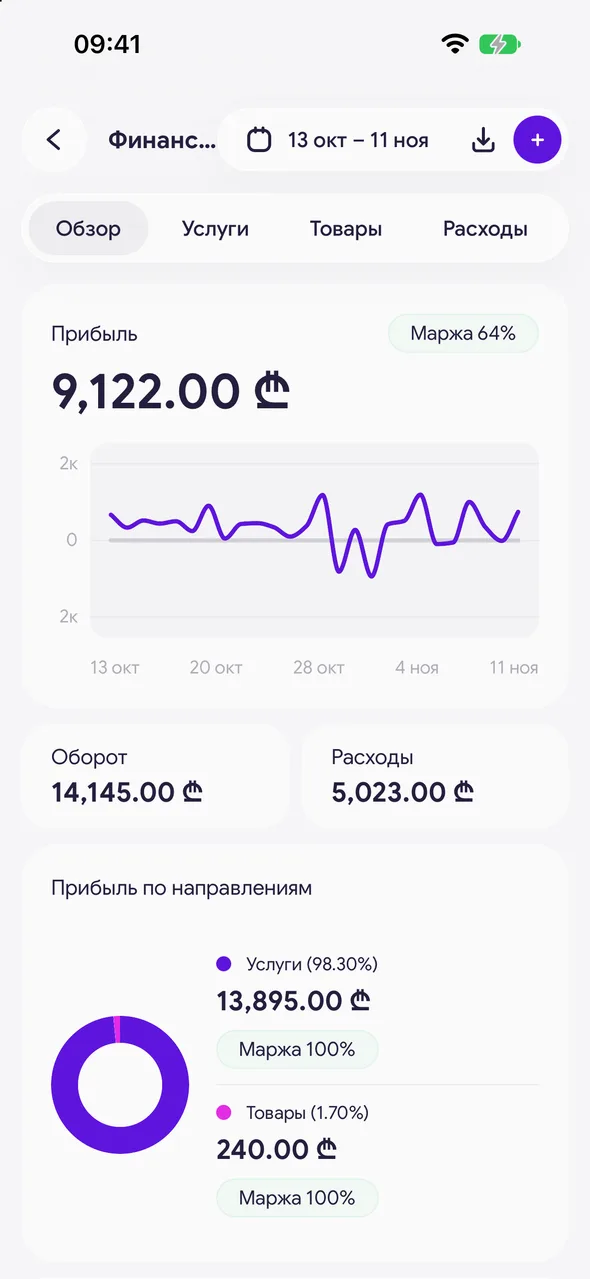
The "Overview" tab
At the top - "Revenue", "Expenses" and "Profit", below "Profit by direction": how much came from services and how much from goods. Then "Occupancy", "Average check per client", "Turnover" broken down by "Cash" / "Card" / "Not specified", "Services provided", "Goods sold" and "Payouts to employees". Tapping a card opens its tab.
- 04
Transaction feed
Below the figures - all transactions for the period by day: visits, sales, income and expenses. Tap a visit to open its calculation, or a transaction to edit it.
Good to know
Tabs: "Overview", "Services", "Goods", "Expenses", "Clients" and "Team" (the last one - if the salon has more than one employee). You can also switch by swiping.
Only completed visits are included in finances. Buying stock for the warehouse does not reduce profit - the money turned into inventory; expenses include the cost of what was sold or written off.
Without a plan, the section shows sample figures with a label so you can see what it looks like.
Questions and answers
FAQ
Why is revenue lower than I expect?
Check the cash desk: unfinished visits and visits awaiting confirmation are not included in finances. Also check the period selected in the section header.
What does "Not specified" mean in revenue?
Money with no payment method marked - for example, visits and transactions entered before the payment choice appeared in the app.
See also
Free for a solo master
Try Easy Beezy
Calendar, clients, services and an online booking page - with no time limit. For a salon with a team - 14 days of full access.


